
Percentage weight loss is calculated as [(starting weight − current weight) ÷ starting weight] × 100. A change from 200 lb to 180 lb equals 20 lb lost, or 10% of starting body weight.
But does that percentage show what changed in the body, or whether health improved? The arithmetic answers a narrower question. It describes weight change relative to a starting measurement. Its usefulness depends on consistent measurements, a clearly defined timeframe, and a careful distinction between weight loss and health outcomes.
By Empire Medical Wellness Editorial Team
Table of Contents
- How to Calculate Percentage Weight Loss Step by Step
- Turning a Percentage Into a Goal Weight
- Tracking Progress Without Misreading the Numbers
- What 5% and 10% Benchmarks Mean Clinically
- When a Percentage Misleads You
- Bring Your Numbers to a Physician Visit
How to Calculate Percentage Weight Loss Step by Step
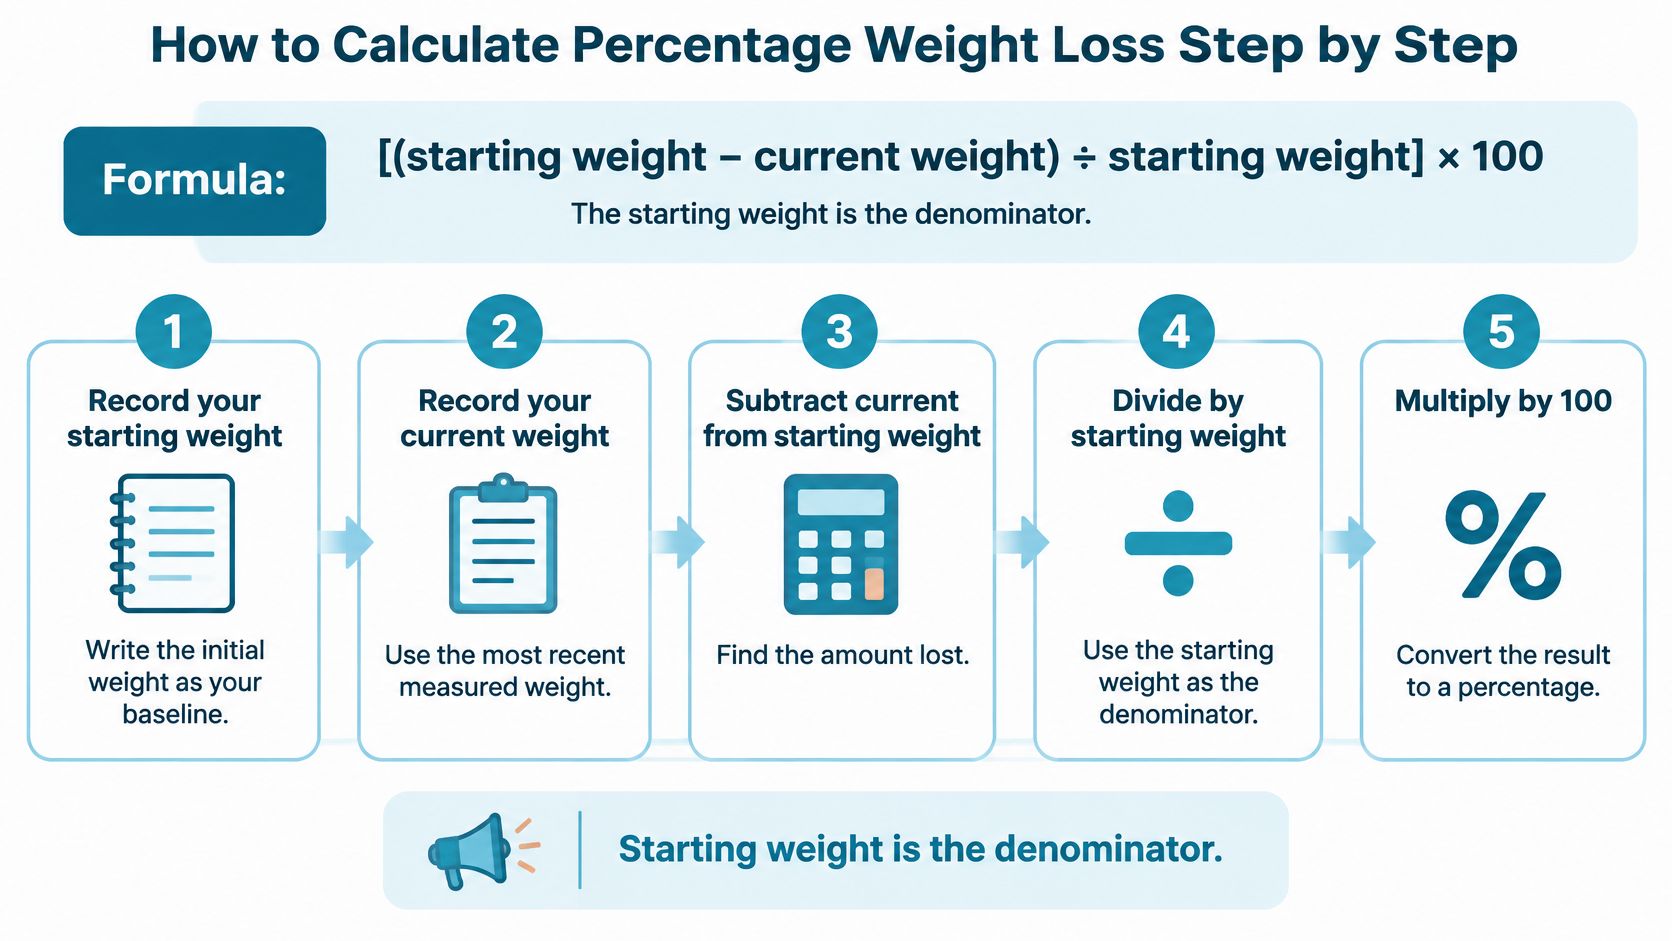
[(starting weight − current weight) ÷ starting weight] × 100
The starting weight is the denominator, meaning the number below the division line. The U.S. Food and Drug Administration defines percent total body-weight loss using this baseline-based formula; a change from 200 lb to 180 lb equals 10% total body-weight loss.
A phone calculator, a written starting measurement, and a current measurement are enough to perform the calculation. Both weights must use the same unit.
Follow the calculation in order
The following hypothetical example uses the starting and follow-up weights above.
- Record the starting weight. Write down the baseline weight, its date, and whether the measurement is in pounds or kilograms. In this example, the starting measurement is 200 lb.
- Record the current weight. Obtain a comparable measurement using the same scale when possible, at a similar time and in similar clothing. The current measurement in this example is 180 lb.
- Subtract current weight from starting weight. The calculation is 200 − 180 = 20 lb lost.
- Divide the amount lost by starting weight. Calculate 20 ÷ 200 = 0.10. This decimal expresses the loss as a fraction of baseline weight.
- Convert the decimal to a percentage. Multiplying 0.10 by 100 gives 10%. For a result with more decimal places, rounding to one decimal place is usually sufficient for a readable tracking log.
The process can also be checked visually.
Why the denominator matters
Dividing by current weight answers a different question: how large the amount lost is relative to the remaining weight. That isn't the standard calculation for percentage weight loss.
With the correct denominator, the example means that the person's current weight is 90% of baseline. It doesn't mean that the person lost that percentage of the final measurement.
Arithmetic check: The amount lost belongs on top of the fraction. The starting weight belongs on the bottom.
The same method works in kilograms because matching units cancel during division. In the FDA's formula, a hypothetical change from 100 kg to 90 kg also represents 10% loss. Converting pounds to kilograms isn't necessary if both measurements already use pounds.
Clinical studies commonly call this measure percent total body-weight loss, abbreviated %TBWL. “Total” distinguishes the whole starting body weight from other possible reference amounts.
A final check concerns the sign. If current weight exceeds starting weight, the subtraction produces a negative result. That indicates a percentage increase in weight, rather than a loss. The calculation isn't broken; the direction of change is different.
Turning a Percentage Into a Goal Weight
A percentage can also be used to calculate a corresponding weight. First, multiply starting weight by the target percentage expressed as a decimal. Then subtract that amount from starting weight.
The National Institute of Diabetes and Digestive and Kidney Diseases gives this example: at 240 lb, a 5% target corresponds to 240 × 0.05 = 12 lb, producing a goal weight of 228 lb after subtraction.
Target weight loss at common starting weights
The table applies that same calculation. Each cell shows pounds to lose, not the resulting goal weight.
| Starting weight | 5% target loss | 10% target loss | 15% target loss |
|---|---|---|---|
| 150 lb | 7.5 lb | 15 lb | 22.5 lb |
| 180 lb | 9 lb | 18 lb | 27 lb |
| 200 lb | 10 lb | 20 lb | 30 lb |
| 240 lb | 12 lb | 24 lb | 36 lb |
| 300 lb | 15 lb | 30 lb | 45 lb |
Reading a row means identifying the starting measurement, selecting the percentage under consideration, and finding the matching loss amount. Subtracting that amount from the starting measurement gives the corresponding goal weight.
The table is a mathematical reference, not a set of recommended targets. It doesn't establish whether weight loss is appropriate or which percentage would suit an individual.
What a target can and cannot establish
Several distinctions help prevent a planning number from becoming an unrealistic expectation.
- Baseline, not ideal weight. The percentage applies to the selected starting measurement. It isn't calculated from an ideal-weight estimate or a weight derived from body mass index.
- Relative, not fixed. The same percentage represents different amounts at different starting weights. A percentage target therefore can't be translated into one universal number of pounds.
- Planning, not prediction. A calculated goal describes a possible endpoint. It doesn't predict treatment response or promise that a particular result will occur.
The calorie deficit formula guide addresses a separate calculation involving energy intake and expenditure. A percentage-loss calculation itself contains no information about calorie needs, nutrition adequacy, or the treatment approach needed to reach a target.
Recording the proposed goal alongside the date it was set makes later discussions clearer. Keeping the original baseline in the record also helps distinguish a revised goal from a change in the reference measurement.
Tracking Progress Without Misreading the Numbers
Consistent measurement makes a percentage more useful. Weighing on the same calibrated scale when possible, at a similar time, and in comparable clothing and footwear reduces avoidable differences between readings, as described in the NHLBI clinical guidelines.
A useful record identifies the starting date, weight, and unit before adding follow-up measurements. It also names the reference point, such as the beginning of a treatment plan, rather than leaving “starting weight” undefined.
A practical tracking log
A spreadsheet or notebook can preserve both the calculation and the circumstances behind it.
| Field | What to record | Why it helps |
|---|---|---|
| Date | Measurement date | Establishes the observation period |
| Weight | Measured weight | Preserves the underlying value |
| Unit | Pounds or kilograms | Prevents mixed-unit calculations |
| Measurement conditions | Scale, timing, clothing, footwear | Flags readings that may not be comparable |
| Percentage from baseline | Calculated total change | Keeps the reference consistent |
| Average rate per month | Total percentage loss divided by elapsed months | Adds time context |
Weekly averages, when available and appropriate to the agreed monitoring plan, can support a more useful conversation than an isolated daily reading. The record should distinguish an individual measurement from an average rather than treating them as interchangeable.
A trend is easier to interpret when the record preserves how each measurement was obtained.
Total change and rate answer different questions
Total percentage loss describes the size of the change. Rate describes how quickly that change occurred.
For a hypothetical reduction from 240 lb to 216 lb, total loss is 10%; over 6 months, the average is approximately 1.67 percentage points per month, using the longitudinal calculation described in this clinical review of weight-loss outcomes.
Percentage points per month is the clearer label. It avoids implying that the same relative fraction of the remaining body weight was lost every month. An average rate also doesn't establish that progress was steady throughout the observation period.
Comparing pounds alone can make a heavier person's change look larger without accounting for starting size. Percentage loss supplies that context, but both the absolute change and the percentage remain useful.
Body mass index, or BMI, is a weight-for-height measure. A BMI percentage isn't a substitute for the requested body-weight calculation, even though the measures can move together when height remains unchanged. The weight-loss plateau guide addresses another tracking question: how to interpret a period without an obvious downward trend.
What 5% and 10% Benchmarks Mean Clinically
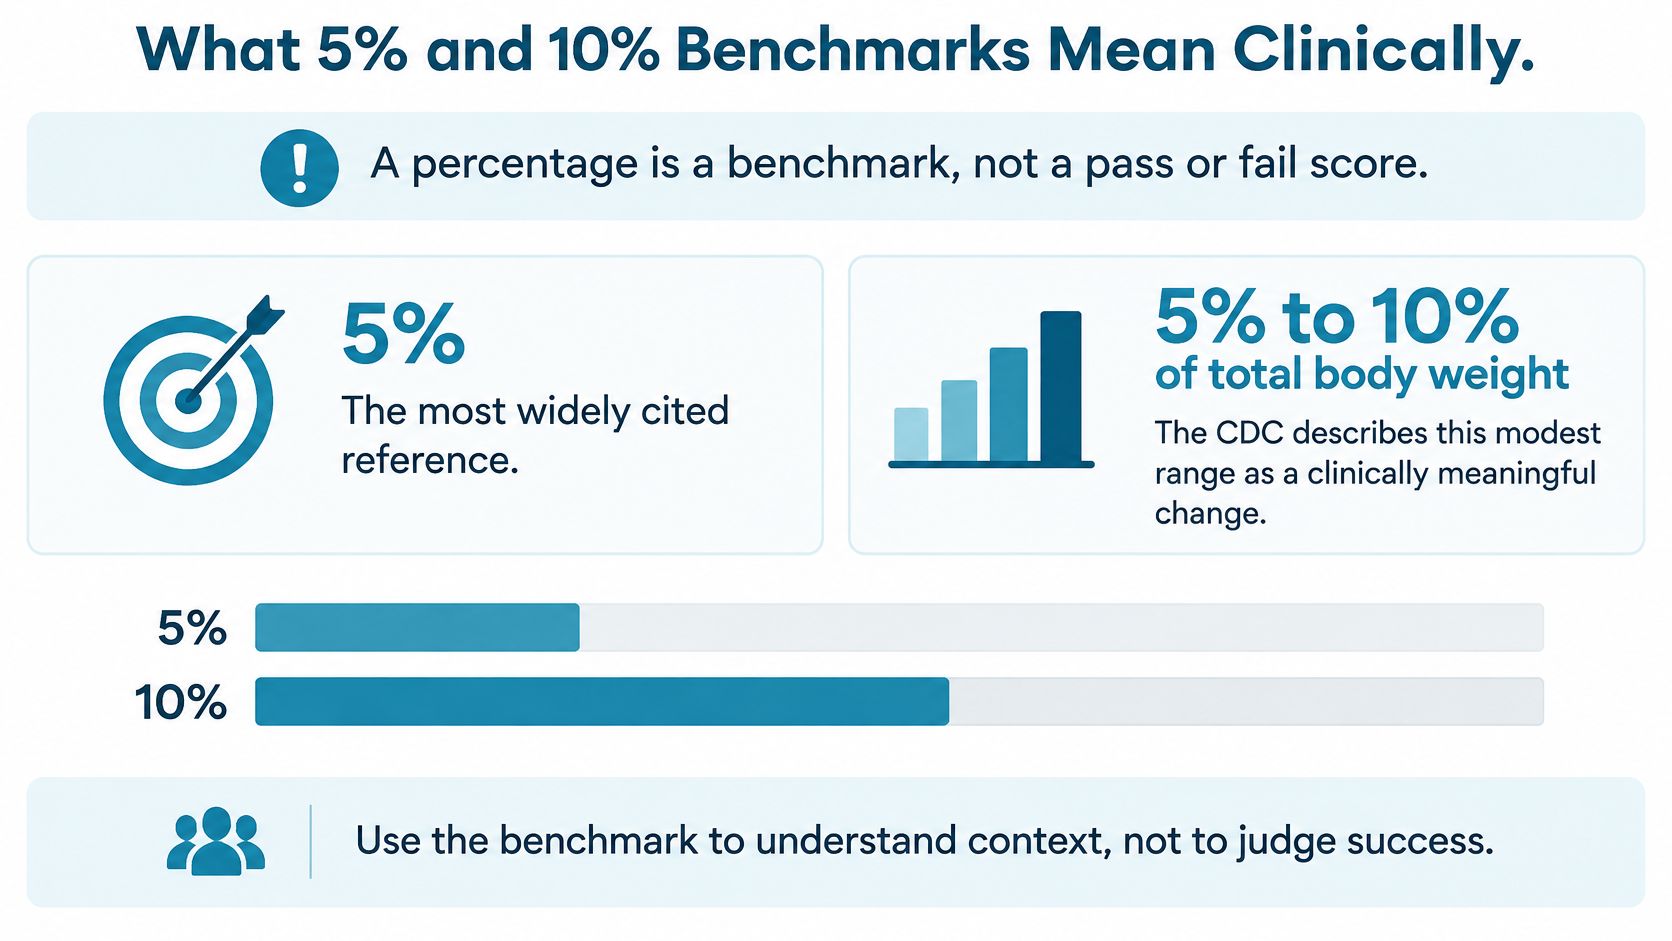
A percentage is a benchmark, not a pass or fail score. The CDC's guidance on losing weight describes 5% to 10% of total body weight as a modest range that can produce health benefits, while placing weight change in the context of health rather than appearance.
The historical role of the smaller benchmark helps explain its prominence. A review of FDA obesity-drug guidance published in Circulation explains that earlier discussions linked diet-related losses of 5% to 10% with improvements in blood pressure, glucose measures, triglycerides, and HDL cholesterol, and that advisory discussions also considered a 10% to 15% range clinically significant.
These are measures of cardiometabolic health, meaning factors related to cardiovascular health and the body's handling of energy. They aren't interchangeable with the number on a scale.
Common percentage-loss benchmarks and what they show
The comparison below summarizes how these reference points appear in guidance and clinical literature.
| Percent of baseline weight | Where the benchmark appears | What it shows and what it does not |
|---|---|---|
| 5% | CDC's modest-loss range and earlier FDA-related discussions | Associated with measurable improvements in some cardiometabolic measures in studies; doesn't guarantee an individual outcome |
| 10% | Older NIH and NHLBI guidance describing an initial treatment goal | Provides a treatment-planning reference; doesn't define success for every person |
| 15% | Earlier FDA advisory discussions of clinically significant loss ranges | Can describe the share of study participants reaching a threshold; isn't a universal personal target |
The limitation isn't merely theoretical. A 2025 scoping review of weight-loss targets found that studies often didn't explain whether percentage targets translated into the health outcomes they intended to improve, and identified limited evidence for percentage thresholds as standalone measures of treatment success.
Questions that make a result clinically useful
A physician-led assessment separates the calculation from its meaning.
- How much changed? Record the measured change without treating the result as a judgment about effort or character.
- Over what timeframe? Establish when the observation began and whether the result represents active loss, maintenance, or regain.
- Which health outcomes changed? Review relevant blood pressure or glucose measurements, mobility, symptoms, and medication tolerability.
Maintaining an earlier loss may remain valuable even when the current percentage barely changes. A smaller change or plateau can also coexist with meaningful clinical progress, so a qualified clinician must interpret the broader picture.
The obesity medication guidance provides context for medication-related discussions. A calculated threshold alone shouldn't determine whether treatment continues, stops, or changes.
When a Percentage Misleads You
A percentage describes the change in total measured weight. It doesn't identify which tissues or fluids changed, and it doesn't establish how a study's result applies to an individual. Two people can report the same figure and be in entirely different situations, one holding steady for a year, the other reaching the number three weeks ago after a large early drop. The arithmetic matches; the meaning does not.
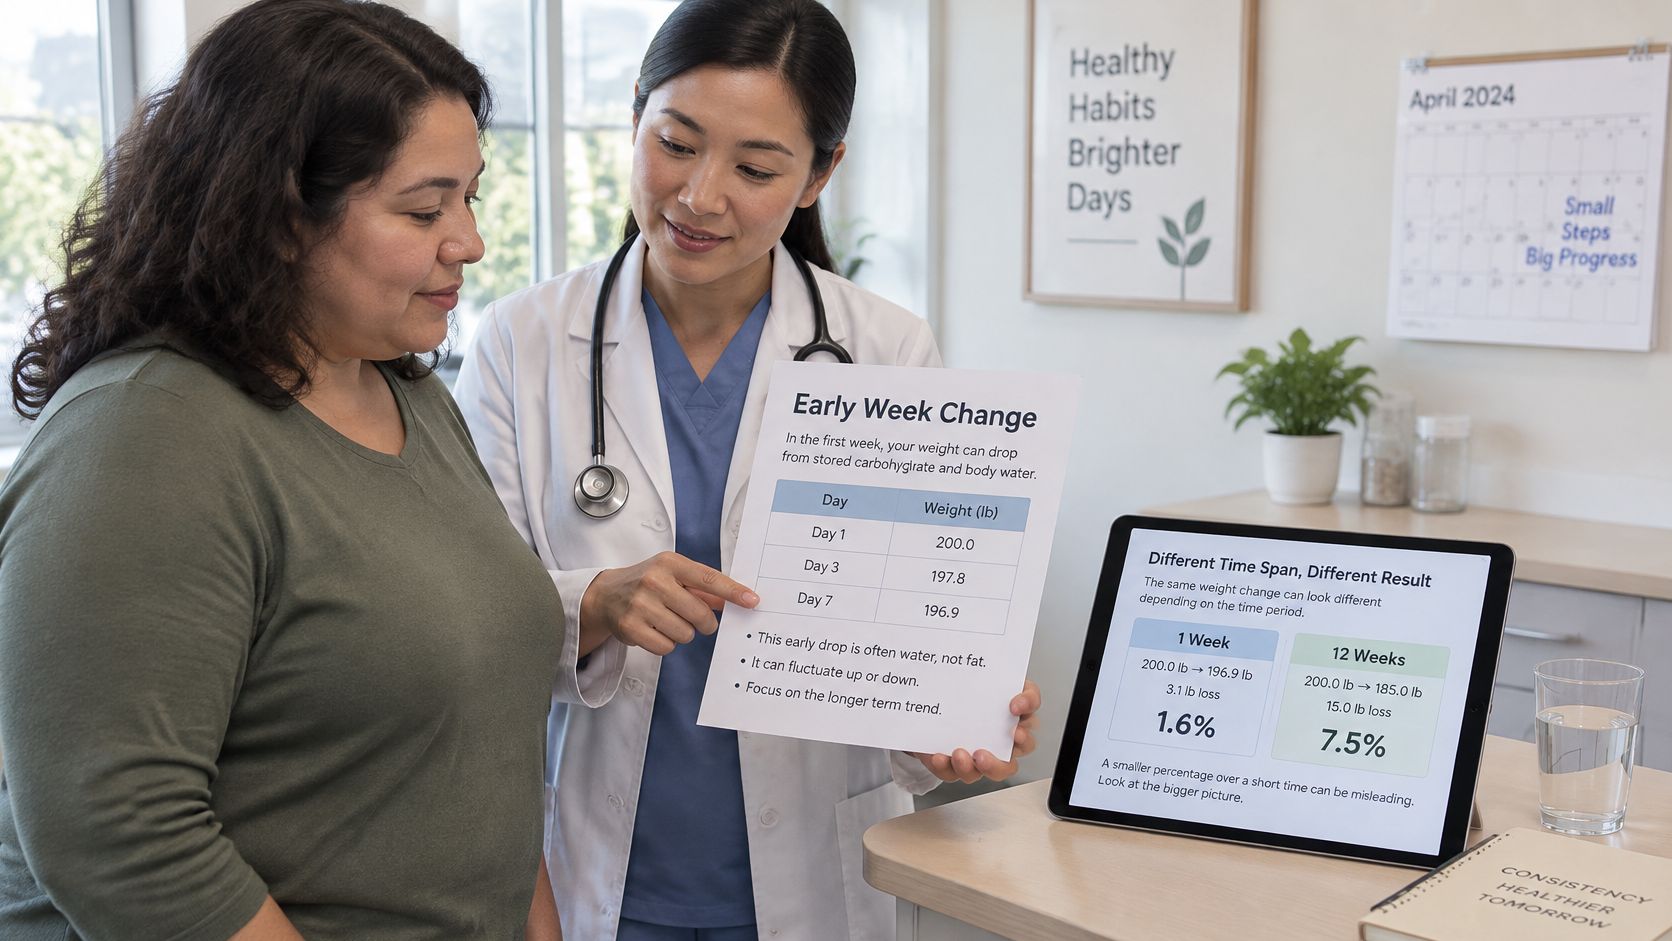
When scale change is mistaken for fat change
Early changes may include substantial water shifts. Stored carbohydrate, called glycogen, is bound with water, and changes in that storage can move measured weight within days. A short-term increase therefore doesn't automatically establish fat regain, just as an early decrease doesn't establish equivalent fat loss.
A 2025 review of body-composition changes during weight loss reported that, across dietary, surgical, and pharmacologic approaches, roughly 70%–75% of lost weight is often fat mass and 25%–30% is fat-free mass, with the fat-free proportion tending to rise during faster or larger losses.
Fat-free mass means everything other than fat, not muscle alone. It includes water and other tissues, so the percentage of fat-free weight lost shouldn't be described automatically as the percentage of muscle lost.
Body-composition testing doesn't remove all uncertainty. Bioelectrical impedance analysis estimates composition indirectly, and its results carry limits in precision and accuracy. Longer-term weight patterns, functional changes, nutrition, activity, and relevant clinical measurements provide additional context.
When the reference or study population changes
A study may define baseline after a preliminary run-in period rather than at the first screening visit. Selecting a different reference changes the question the percentage answers. Because a percentage is a ratio, the denominator matters as much as the numerator: move the starting point and the same absolute change produces a different figure.
Other reporting choices can obscure the trajectory. A later low-weight reference can hide prior regain, while results limited to participants who completed treatment may not represent everyone who began it.
Before comparing results, four checks help:
- Reference point. Identify exactly which measurement served as baseline.
- Timeframe. Confirm the interval covered by the reported change.
- Participants counted. Determine whether results include everyone enrolled or only completers.
- Metric used. Distinguish total body-weight loss from excess body-weight loss, which uses weight above a selected target as its denominator.
The BMI guide explains another measure that needs context rather than isolated interpretation.
Interpretation rule: A precise calculation can still answer the wrong clinical question.
At Empire Medical Wellness, obesity medicine evaluations weigh more than the percentage. They consider weight and growth history alongside previous treatment, current medications and relevant health conditions, eating, activity, and sleep patterns, and the patient's own goals.
Bring Your Numbers to a Physician Visit
A useful appointment record doesn't need a polished chart. It needs enough information to show where the measurements began, how the pattern developed, and which concerns matter to the patient.
Missing measurements can remain missing. Reconstructing a smooth trend from uncertain recollections is less useful than labeling what is known and what is estimated.
Preparation checklist
- Starting measurement. Include the weight, date, unit, and the reason that point was chosen as baseline.
- Current pattern. Bring recent measurements, available averages, and the monthly rate calculation.
- Possible goals. Record goal weights considered and what those goals are intended to improve.
- Health concerns. Note symptoms, functional difficulties, and other concerns relevant to the visit.
- Medication list. Include current prescriptions, nonprescription medicines, and supplements.
- Daily routines. Summarize sleep and activity patterns without trying to make them appear ideal.
- Previous approaches. Describe what was tried, what happened, and what made continuation or maintenance difficult.
At Empire Medical Wellness, the first obesity medicine appointment is 50 minutes and focuses on weight history, health concerns, previous approaches, current medications, goals, and appropriate treatment options. The patient leaves with recommended next steps and a follow-up plan.
The first obesity medicine appointment guide offers additional preparation context.
Questions for the discussion
The most useful questions connect measurements to decisions rather than requesting a single target.
- Measures beyond weight. Which health or functional measures will guide assessment?
- Review schedule. How will progress be reviewed?
- Reasons to reconsider. What findings would prompt a change in approach?
- Maintenance. How will the plan address maintaining progress over time?
Medication decisions, dosing, and treatment changes require individual assessment by a qualified clinician. They shouldn't follow automatically from a calculator result.
Follow-up visits at Empire Medical Wellness build on earlier decisions, assess response, address obstacles, and adjust treatment when needed. Preserving the measurement record helps those discussions stay specific without making weight the only measure of care.
Sources
The linked references include FDA guidance, NIDDK patient education, NHLBI clinical guidelines, CDC guidance, a Circulation review of regulatory benchmarks, and peer-reviewed reviews addressing outcome measurement, treatment targets, and body composition.
Empire Medical Wellness offers physician-led obesity medicine assessment, individualized treatment planning, and ongoing monitoring that places weight trends alongside health history and personal goals. Adults considering this approach can visit Empire Medical Wellness to learn more. This article is educational and isn't personal medical advice.