
You're looking at an obesity index chart after entering your height and weight, or perhaps a clinician has mentioned BMI during a visit. The chart can show where an adult's weight-to-height measurement falls, but it can't diagnose obesity, measure body fat, or choose treatment. Think of it as a smoke alarm: it signals that a closer clinical look may be useful, not that it tells the whole story.
Table of Contents
- What an Obesity Index Chart Shows
- How to Calculate BMI and Read the Adult Chart
- Comparing BMI With Waist Circumference and Other Measures
- Reading the Chart for Children and Teens
- Where BMI Misleads and How Clinicians Adjust Interpretation
- What the Charts Cannot Tell You About an Individual
- Screening Result Versus Treatment Decision
- A Clinician Decision Checklist for Your Visit
- Talking About Chart Results Without Labels
- When to Bring Your Numbers to a Physician
What an Obesity Index Chart Shows
For adults, an obesity index chart serves mainly as a BMI-based screening reference. BMI, or body mass index, compares weight with height. The standard adult categories are underweight below 18.5, healthy weight from 18.5 to 24.9, overweight from 25.0 to 29.9, and obesity at 30.0 or higher, according to the CDC adult BMI categories. Adult obesity is further divided into Class 1 (30.0–34.9), Class 2 (35.0–39.9), and Class 3 (40.0+), per the CDC classification.
| BMI (kg/m²) | Weight category |
|---|---|
| Below 18.5 | Underweight |
| 18.5 to 24.9 | Healthy weight |
| 25.0 to 29.9 | Overweight |
| 30.0 to 34.9 | Class 1 obesity |
| 35.0 to 39.9 | Class 2 obesity |
| 40.0 or higher | Class 3 obesity |
These categories create a shared starting point for a clinical conversation. A clinician may then review weight history, waist circumference, blood pressure, laboratory findings, sleep, medications, and other health factors. The labels describe a measurement range, not a person's character or effort. For context on obesity-related care, see this overview of obesity and treatment considerations.
Adults and children use different references
Children and adolescents require age- and sex-specific BMI-for-age references because height, body composition, and BMI change during growth and puberty. The WHO 5-to-19-year BMI-for-age reference defines obesity as BMI-for-age above +2 standard deviations, using a growth-based measure rather than a fixed adult cutoff.
For an adult, the chart assigns a category. For a child, a clinician checks the correct growth reference, considers the child's position within it, and reviews the pattern over time. In either case, the chart supports screening and discussion. It cannot, by itself, establish a diagnosis or determine treatment.
How to Calculate BMI and Read the Adult Chart
BMI uses one of two equivalent formulas:
- Metric: weight in kilograms divided by height in meters squared, or kg/m².
- Imperial: 703 multiplied by weight in pounds, divided by height in inches squared.
A hypothetical metric example makes the process clearer. An adult who weighs 70 kilograms and is 1.70 meters tall has a BMI of approximately 24.2:
70 ÷ (1.70 × 1.70) = 24.2
That result falls in the adult healthy-weight category on the standard chart. It doesn't prove that the person has no health risks, and it doesn't establish that the category is an ideal target for that individual.
Now consider a separate hypothetical imperial example. An adult who weighs 165 pounds and is 5 feet 7 inches tall is 67 inches tall. Using the imperial formula:
703 × 165 ÷ (67 × 67) = approximately 25.8
That result falls in the overweight category. Again, this is a classification from a screening formula, not a personal diagnosis.
The Empire BMI calculator can help with the arithmetic, while a broader care plan guide for 2026 may help readers think about how measurements fit into a structured medical conversation. Neither tool can determine whether medication, a procedure, or a particular nutrition plan is appropriate.
Practical rule: Calculate BMI accurately, record the result, then ask what the number leaves out.
BMI groups weight in relation to height. It doesn't directly measure fat, muscle, bone, fluid, waist distribution, metabolic health, or physical function. A category can prompt evaluation, but it shouldn't independently trigger treatment.
Comparing BMI With Waist Circumference and Other Measures
BMI is useful because it's standardized and reproducible. It becomes more informative when paired with a measure that addresses where body fat is carried, especially around the abdomen.
| Measure | What it captures | How it is obtained | Where it can mislead |
|---|---|---|---|
| BMI | Weight relative to height | Weight and height entered into a formula | It doesn't distinguish muscle, bone, fluid, or fat distribution |
| Waist circumference | Abdominal size and a proxy for central adiposity | Tape measure placed consistently around the waist | Results vary with technique, body shape, and the reference threshold used |
| Waist-to-height ratio | Waist size in relation to height | Waist circumference divided by height, using the same units | It can oversimplify risk and shouldn't replace clinical assessment |
| Body fat percentage | Estimated proportion of body weight that is fat | DXA, bioimpedance, skinfolds, or other methods | Accuracy depends heavily on the method, device, hydration, and operator |
AACE's risk-based framework uses waist circumference alongside BMI. For non-Asian adults, waist circumference at or above 102 centimeters in men or 88 centimeters in women signals increased cardiometabolic risk in that framework. The AACE obesity classification and risk chart also recognizes that waist thresholds differ for Asian adults.
Waist-to-height ratio is often discussed using a simple rule of thumb, keeping the waist smaller than half of height. It can be easy to understand, but a clinician still needs to consider how the measurement was taken and whether it adds meaningful information for that person.
Body fat testing can provide another perspective. DXA is different from a home bioimpedance scale, and skinfold measurement depends on technique. A home device may show a changing estimate without reliably proving that body fat has changed.
Exercise planning and weight-management goals can be discussed separately from medical screening. For general planning ideas, readers may find a profitable gym weight loss challenge useful, but fitness content shouldn't substitute for evaluation of blood pressure, glucose, medications, sleep, or other health concerns. The metabolic health resources from Empire can provide additional context about why central adiposity and metabolic markers may matter together.
Reading the Chart for Children and Teens
Adult BMI cutoffs don't apply to minors. For children and adolescents, clinicians plot BMI against an age- and sex-specific growth reference. The result is a percentile or z-score that shows how the measurement compares with peers of the same age and sex.
A parent or caregiver generally needs the child's accurate age, sex, height, and weight. A clinician then plots the BMI on the appropriate growth chart and interprets the result alongside the child's growth pattern, development, medical history, and family context. The same numeric BMI can fall in different percentile positions at different ages, which is why one number can't be interpreted in isolation.
The WHO reference uses BMI-for-age greater than +2 standard deviations to classify obesity for ages 5 through 19 and describes that level as equivalent to adult BMI 30 kg/m² at age 19. This does not mean clinicians should apply adult cutoffs to younger children.
| Percentile range or reference position | Weight status category | Screening note |
|---|---|---|
| Below the 5th percentile | Underweight | Review growth pattern and clinical context |
| 5th to 84th percentile | Healthy weight | Continue routine growth monitoring |
| 85th to 94th percentile | Overweight | Consider a broader growth and health review |
| At or above the 95th percentile | Obesity | Requires clinical interpretation, not a label based on one reading |
Growth trends matter more than a single point. A pediatric clinician may look at changes in height, weight, puberty, nutrition, activity, sleep, medications, and emotional well-being. Families should avoid describing a child as an identity label based on a chart result.
Where BMI Misleads and How Clinicians Adjust Interpretation
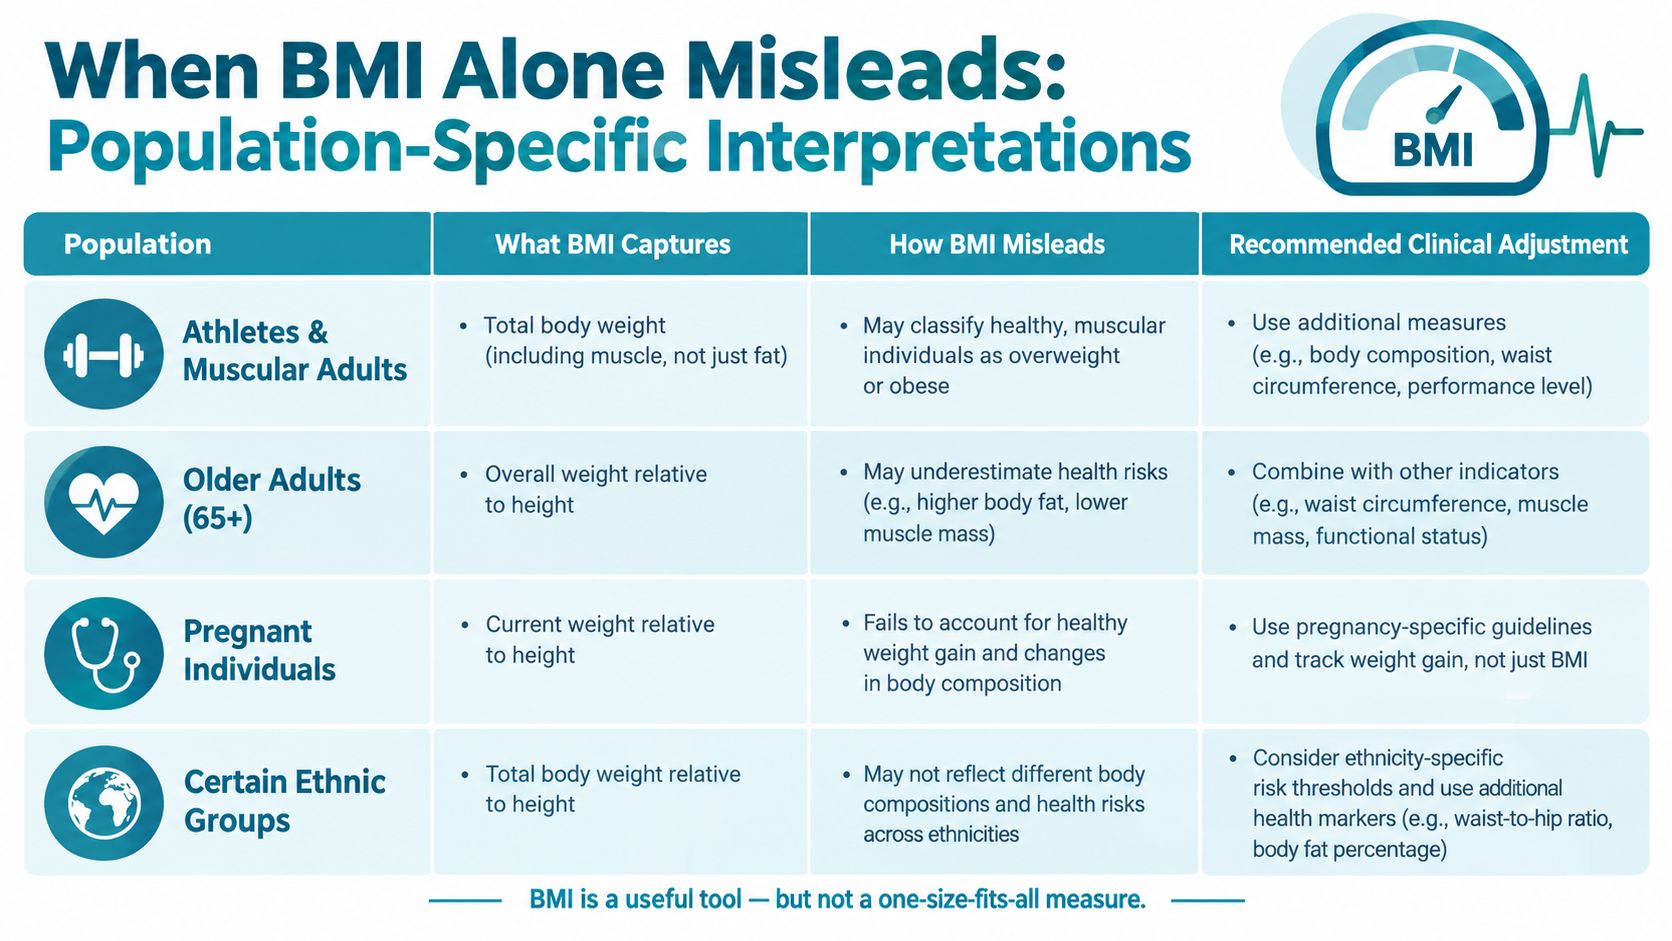
BMI can be informative, but it has predictable blind spots. A muscular athlete may have a higher BMI because muscle adds weight, while an older adult may have less lean mass and still carry clinically relevant abdominal fat. Pregnancy also changes the context in which weight and body composition should be interpreted.
Interpretation is different from changing the cutoff
A clinician generally shouldn't arbitrarily relabel an adult's BMI category. Instead, the clinician keeps the published category and adds context, such as waist circumference, weight history, body-composition testing when valid, physical function, blood pressure, glucose, lipids, and family history.
Ethnic background can also affect risk interpretation. Some Asian populations may experience cardiometabolic risk at lower BMI values, which is why guidelines may use population-specific waist or BMI considerations. This changes how risk is assessed, not the mathematical calculation itself. The CDC's adult BMI screening guidance emphasizes that BMI is a screening measure, not a diagnostic test.
For people with limited mobility, BMI may not reflect changes in muscle mass, activity, or function. A person's ability to walk, climb steps, sleep comfortably, or perform daily tasks may tell the clinician something the chart cannot.
A useful clinical adjustment is to ask whether the chart result changes after these additional measures are considered. The answer may be different for a muscular adult, an older adult, a pregnant individual, or someone whose health risks don't match the BMI category. Adults seeking physician-led assessment can review Empire's obesity medicine service as one possible setting for that conversation.
What the Charts Cannot Tell You About an Individual
A chart is built for standardization across populations. It can't tell you whether abdominal fat is present, how much of your weight is muscle, whether your blood pressure is high, or whether glucose and lipid findings are healthy. It also doesn't measure sleep quality, cardiorespiratory fitness, pain, mobility, inflammation, mental health, medication effects, genetics, or social conditions that affect health and access to care.
Two people can have the same BMI and very different clinical profiles. One may have substantial muscle mass and reassuring metabolic findings. Another may have central adiposity, poor sleep, high blood pressure, and a medication that contributes to weight change. The chart alone can't distinguish those situations.
Population data explain why clinicians use BMI for screening, but they don't determine an individual's health. The NIDDK summarizes the familiar adult BMI cut points while also emphasizing the broader context of overweight and obesity measurement and severity in its obesity health statistics resource. The World Obesity Federation projects that Class II obesity and above may more than double worldwide by 2030, a projection described in its World Obesity Atlas 2025 coverage.
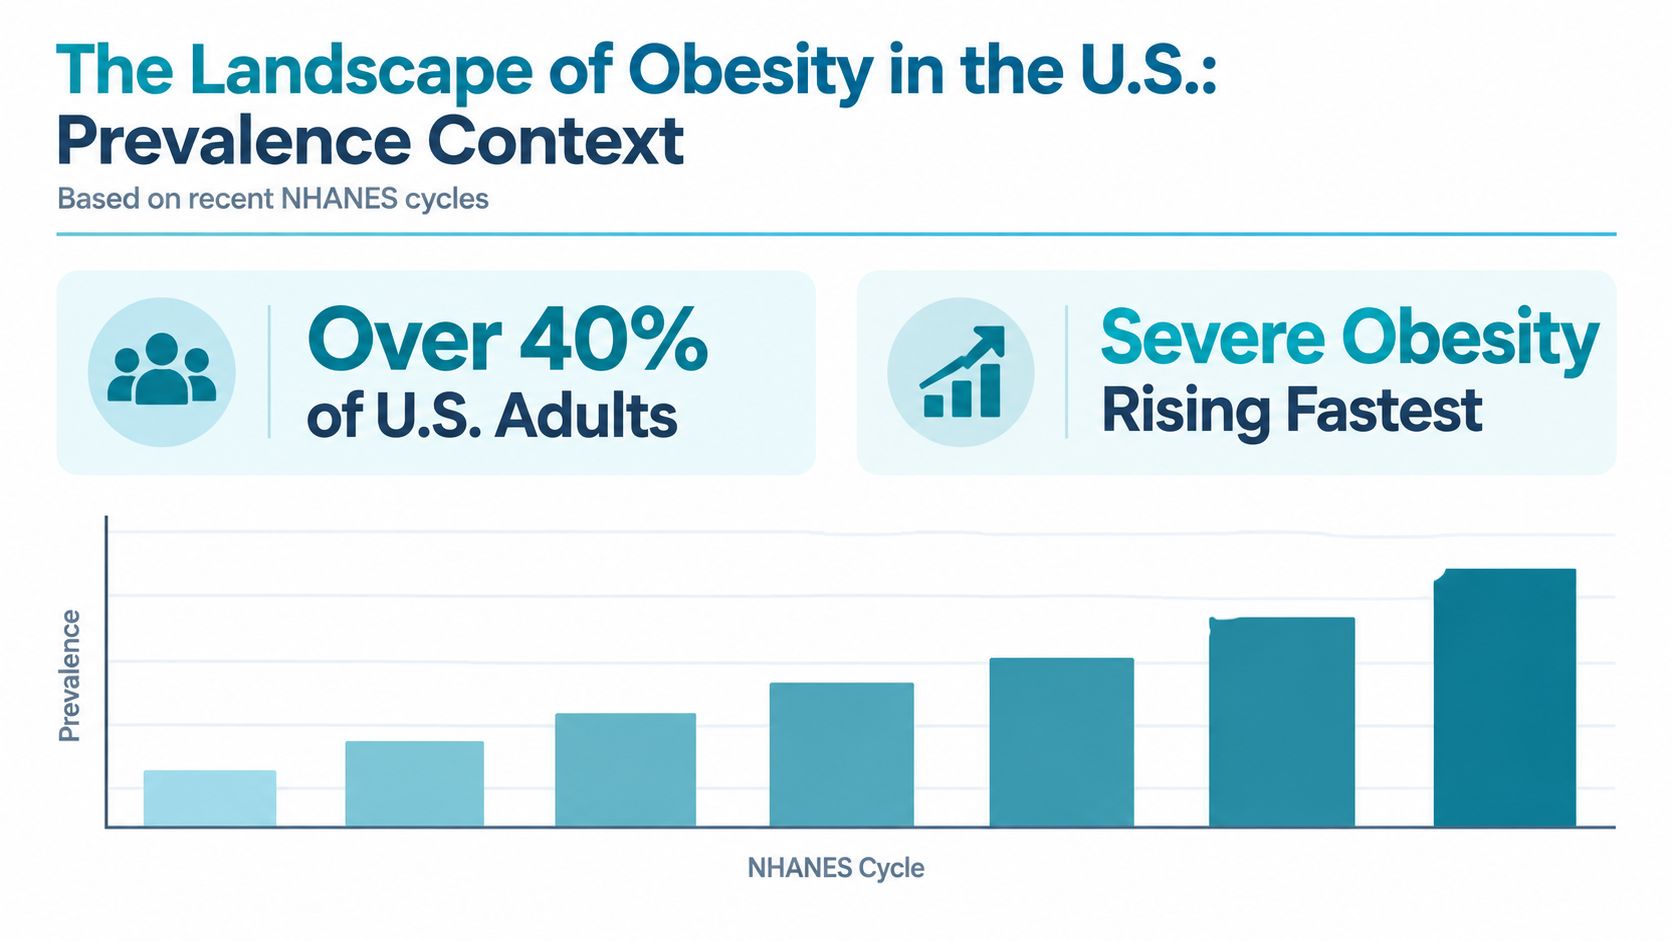
These trends support a population-level need for screening and care. They don't turn an individual category into a verdict. A clinician still needs to connect the measurement with the person's history, current health, goals, and circumstances.
Screening Result Versus Treatment Decision
A screening result answers a narrow question: where does this measurement fall on a standardized reference? A treatment decision answers a much broader question: what care, if any, fits this person after a physician evaluates risks, benefits, preferences, and medical context?
| Screening result | Treatment decision |
|---|---|
| Adult BMI category | Medical history, weight trajectory, blood pressure, laboratory findings, medications, sleep, function, and goals |
| Class 1, Class 2, or Class 3 BMI range | Whether obesity-related complications, treatment risks, or other factors change the care plan |
| Waist measurement suggesting increased risk | Confirmation of measurement technique and review of glucose, lipids, liver health, and family history |
| Child or teen BMI-for-age percentile | Growth pattern, puberty, development, family context, nutrition, sleep, and emotional well-being |
| Unexpected change on a chart | Review for illness, medication effects, fluid changes, lifestyle shifts, or other contributing factors |
Before discussing obesity medicine, a physician may review blood pressure, glucose or A1C, lipids, liver enzymes, sleep apnea symptoms, current medicines, pregnancy status or plans, functional impact, mental health context, and personal goals. A chart can't select a medication or dose.
Lifestyle support, FDA-approved anti-obesity medication when clinically appropriate, and procedural options occupy different points on a treatment spectrum. The clinician must determine whether an option is appropriate rather than treating a BMI number as an automatic prescription or surgery trigger. A calorie-deficit explanation can clarify one nutrition concept, but it isn't a substitute for individualized assessment.
A Clinician Decision Checklist for Your Visit
Use this checklist as conversation support, not as a self-diagnosis tool. Bring the chart result if you have it, but also bring the information that gives the number meaning.
- Personal history: Record your weight trend, meaningful changes, previous approaches, and current medications. Include medicines prescribed by other clinicians.
- Family background: Note family patterns of diabetes, high blood pressure, lipid disorders, sleep apnea, or other relevant conditions.
- Recent health information: Bring available laboratory results. If testing hasn't been done, ask the clinician whether fasting glucose or A1C, a lipid panel, TSH, and liver enzymes are appropriate.
- Function and daily life: Describe sleep quality, snoring or witnessed breathing pauses, joint pain, exercise tolerance, mobility, and activities that have become easier or harder.
- Goals and questions: Explain goals beyond the scale, such as energy, mobility, sleep, or a specific health marker. Ask which measure the clinician trusts most, what risks matter in your situation, and what options exist beyond general lifestyle advice.

You don't need to arrive with every answer. A thoughtful visit can identify which information is missing and which measurements deserve follow-up. The most useful preparation is accurate history, clear goals, and willingness to discuss the parts of health that a chart cannot show.
Talking About Chart Results Without Labels
A smoke alarm alerts you to look for a problem. It doesn't prove that the house is on fire or identify the source. BMI and waist measurements work similarly. A higher range means the clinician may need to look more closely, not that the number defines the person.
Neutral language keeps the conversation specific:
- “My screening result was in a higher range, and I want to understand what it means.”
- “Which additional measures would give a clearer picture for me?”
- “Could my muscle mass, recent weight change, medications, or waist measurement affect the interpretation?”
- “What does this result suggest we should review next?”
With children and teens, focus on growth and health rather than blame. A parent might say, “The growth chart changed, so I'd like to understand the pattern and what support would be appropriate.” That wording leaves room for development, family context, and clinical judgment.
A chart result is information. It isn't an identity, a moral judgment, or proof of disease.
When to Bring Your Numbers to a Physician
A physician-led evaluation can be reasonable when an adult BMI is 30 or higher, when BMI is 25.0 to 29.9 alongside a waist circumference at or above the AACE risk threshold, or when a child or teen's BMI-for-age is at or above the 95th percentile. An unexpected chart change over 3 to 6 months also deserves review, particularly when the change isn't explained by a clear shift in diet, activity, or routine.
These situations matter for different reasons. An adult result may prompt assessment of cardiometabolic risk and treatment options. A child's percentile may call for a growth and development review. An unexpected change may lead a clinician to consider medications, medical conditions, fluid shifts, sleep, stress, or other contributors.
Empire Medical Wellness offers physician-led obesity medicine care that may include medical and metabolic assessment, review of weight history and relevant health factors, individualized planning, medication discussion when clinically appropriate, monitoring, and long-term maintenance planning. Bring the chart, your worked calculation, and the clinician checklist to the appointment so the discussion can move beyond a single number.
If you want physician-led help interpreting an obesity index chart, Empire Medical Wellness offers private outpatient obesity medicine evaluations for adults, with care centered on individualized assessment and follow-up. This article is educational and isn't personal medical advice.